How I saved hours of work and create ready-to-share headcount reports in seconds

As the Director of People Operations at PureCars, I meet with our executives weekly, who meet with our investors quarterly. One of the first things either party wants to look at? A headcount report. It helps us keep a watchful eye on turnover trends and set thoughtful action plans for adding new roles and backfilling old ones. The reports also prove to our board that we’re being good stewards of capital and sticking to headcount budgets.
But if we wanted detailed reports to support our high-stakes headcount planning, then we needed a better system. Here’s how we made a messy process easier, faster, and better.
The problem: Hazy planning
We used to pull headcount stats on Zenefits (now TriNet), but its reporting features were super clunky. I couldn’t drill down into the numbers, spot attrition trends, or figure out why employees left the company.
Plus, it took hours to build the reports. I had to export data from Zenefits into a spreadsheet and manually build formulas to calculate turnover rates. Then I had to rifle through Google Drive folders to figure out termination reasons. Then I compiled all this information into a separate spreadsheet to make the final report that we share with our board and private equity firm.
This pieced-together report didn’t have the cleanest look, which made it hard for investors to analyze the data. And since I did it all manually, it was easy to make errors that threw numbers off.
The solution: In-depth headcount reports
With Rippling, I can pull high-visibility headcount reports in seconds. Here’s how:
Step 1: Create a headcount report
In Rippling’s reporting suite, I set up a headcount report. The platform lets you access pre-built templates that we can customize as needed.
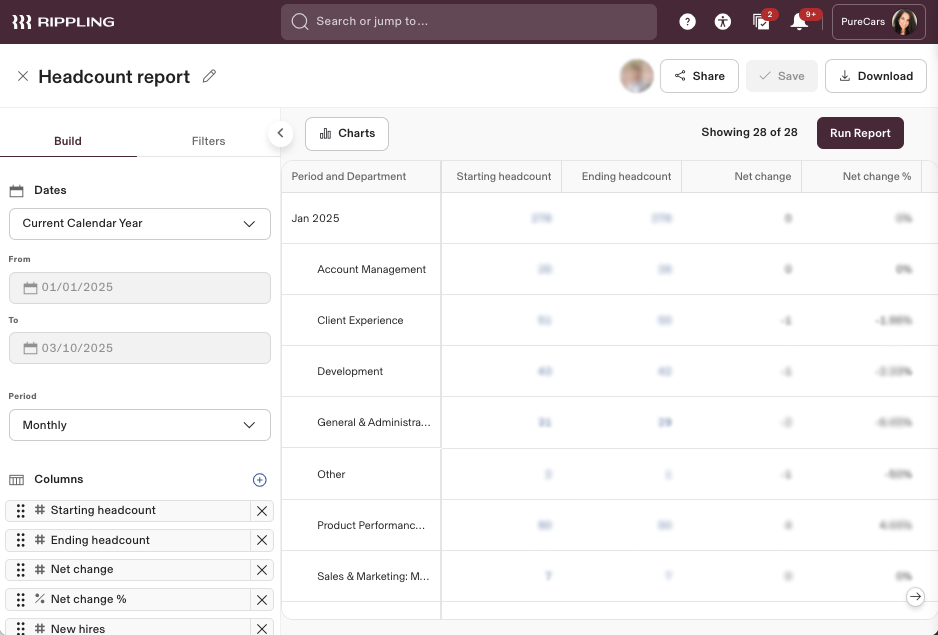
Step 2: Run the report
The report shows us our starting and ending headcount over a specified period across all of our departments. It also shows new hires and terminations, along with retention and termination rates.
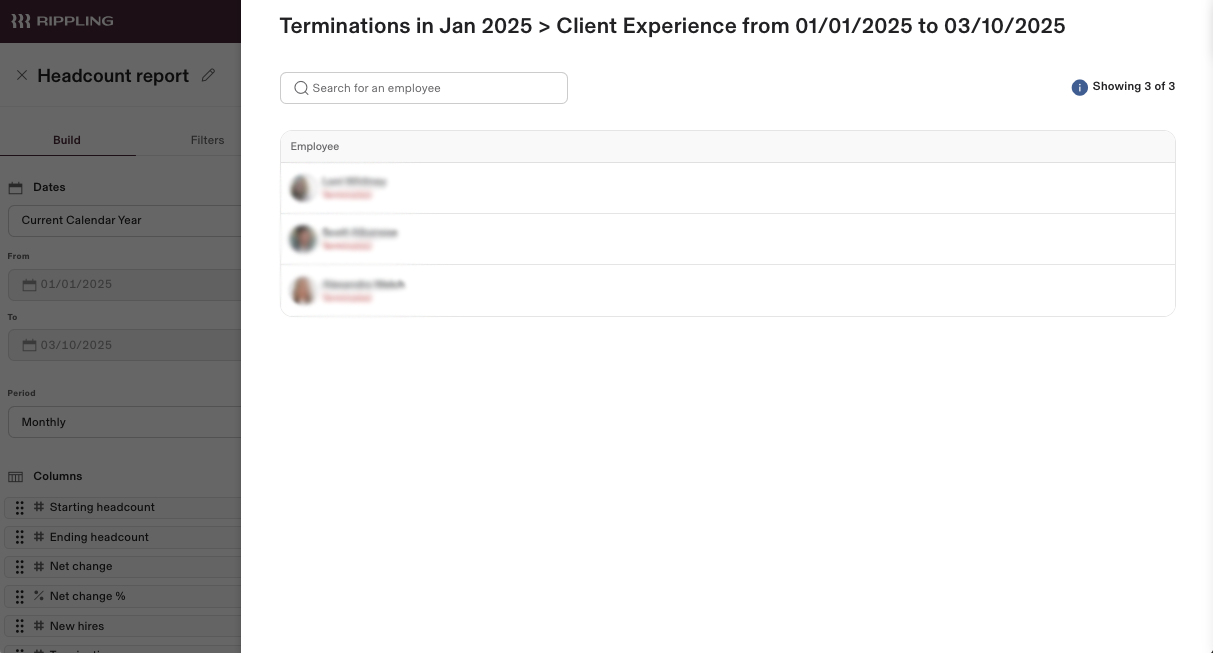
Step 3: Dig into the numbers
The Rippling report lets me click into all the data to get the story behind the numbers. For instance, I can click on the “terminations” amount and get a dropdown list of every employee who was terminated, complete with notes that unpack why.
The impact
Rippling’s headcount reports were a total game-changer.
Time saved
Manually scrapping together headcount reports from different systems took hours. Rippling offers a better version that’s ready to share with my CEO in seconds.
Accurate reporting
Since all our headcount information now flows through one interconnected platform, I can trust our numbers are accurate, which gives our board and investors more confidence that we’re sticking to budgets and keeping costs in check.
Strategic decision-making
These reports also help us backfill high-value roles quickly, build a case for adding new headcount when needed, and address rising turnover before it gets out of hand.
Rippling headcount reports are our guiding light whenever we need to make an important personnel decision.

This blog is based on information available to Rippling as of March 18, 2025.
Disclaimer: Rippling and its affiliates do not provide tax, accounting, or legal advice. This material has been prepared for informational purposes only, and is not intended to provide or be relied on for tax, accounting, or legal advice. You should consult your own tax, accounting, and legal advisors before engaging in any related activities or transactions.