Engineering a SIEM part 2: Rippling's security data lakehouse and modular design

In addressing the requirements and challenges of SIEM solutions, we drew inspiration from data engineering best practices, particularly the use of data lake and warehouses. This led us to the concept of a security data lakehouse, a data lakehouse tailored specifically for security needs. Our approach was further informed by our data engineering team's use of the Snowflake platform for business analytics and data initiatives. But before we dive into the details, let's explore the term data lakehouse and how it differs from security data lakehouse.
What is a security data lakehouse, and how does it differ from a data lakehouse?
A data lakehouse is a centralized storage repository that can store both structured and unstructured data at almost any scale. It enables storing data as-is and supports various types of analytics—from data extraction and visualizations to big data processing and machine learning.
A security data lakehouse is essentially a specialized variant of a data lakehouse focused on storing and managing security-related data. It centralizes data from diverse sources, including logs, system events, threat intelligence feeds, and more, to offer a comprehensive view of security events across an organization.
We chose Snowflake (the platform our data engineering team uses) for our specific needs and challenges because its extensive features align with our requirements.
Log ingestion architecture
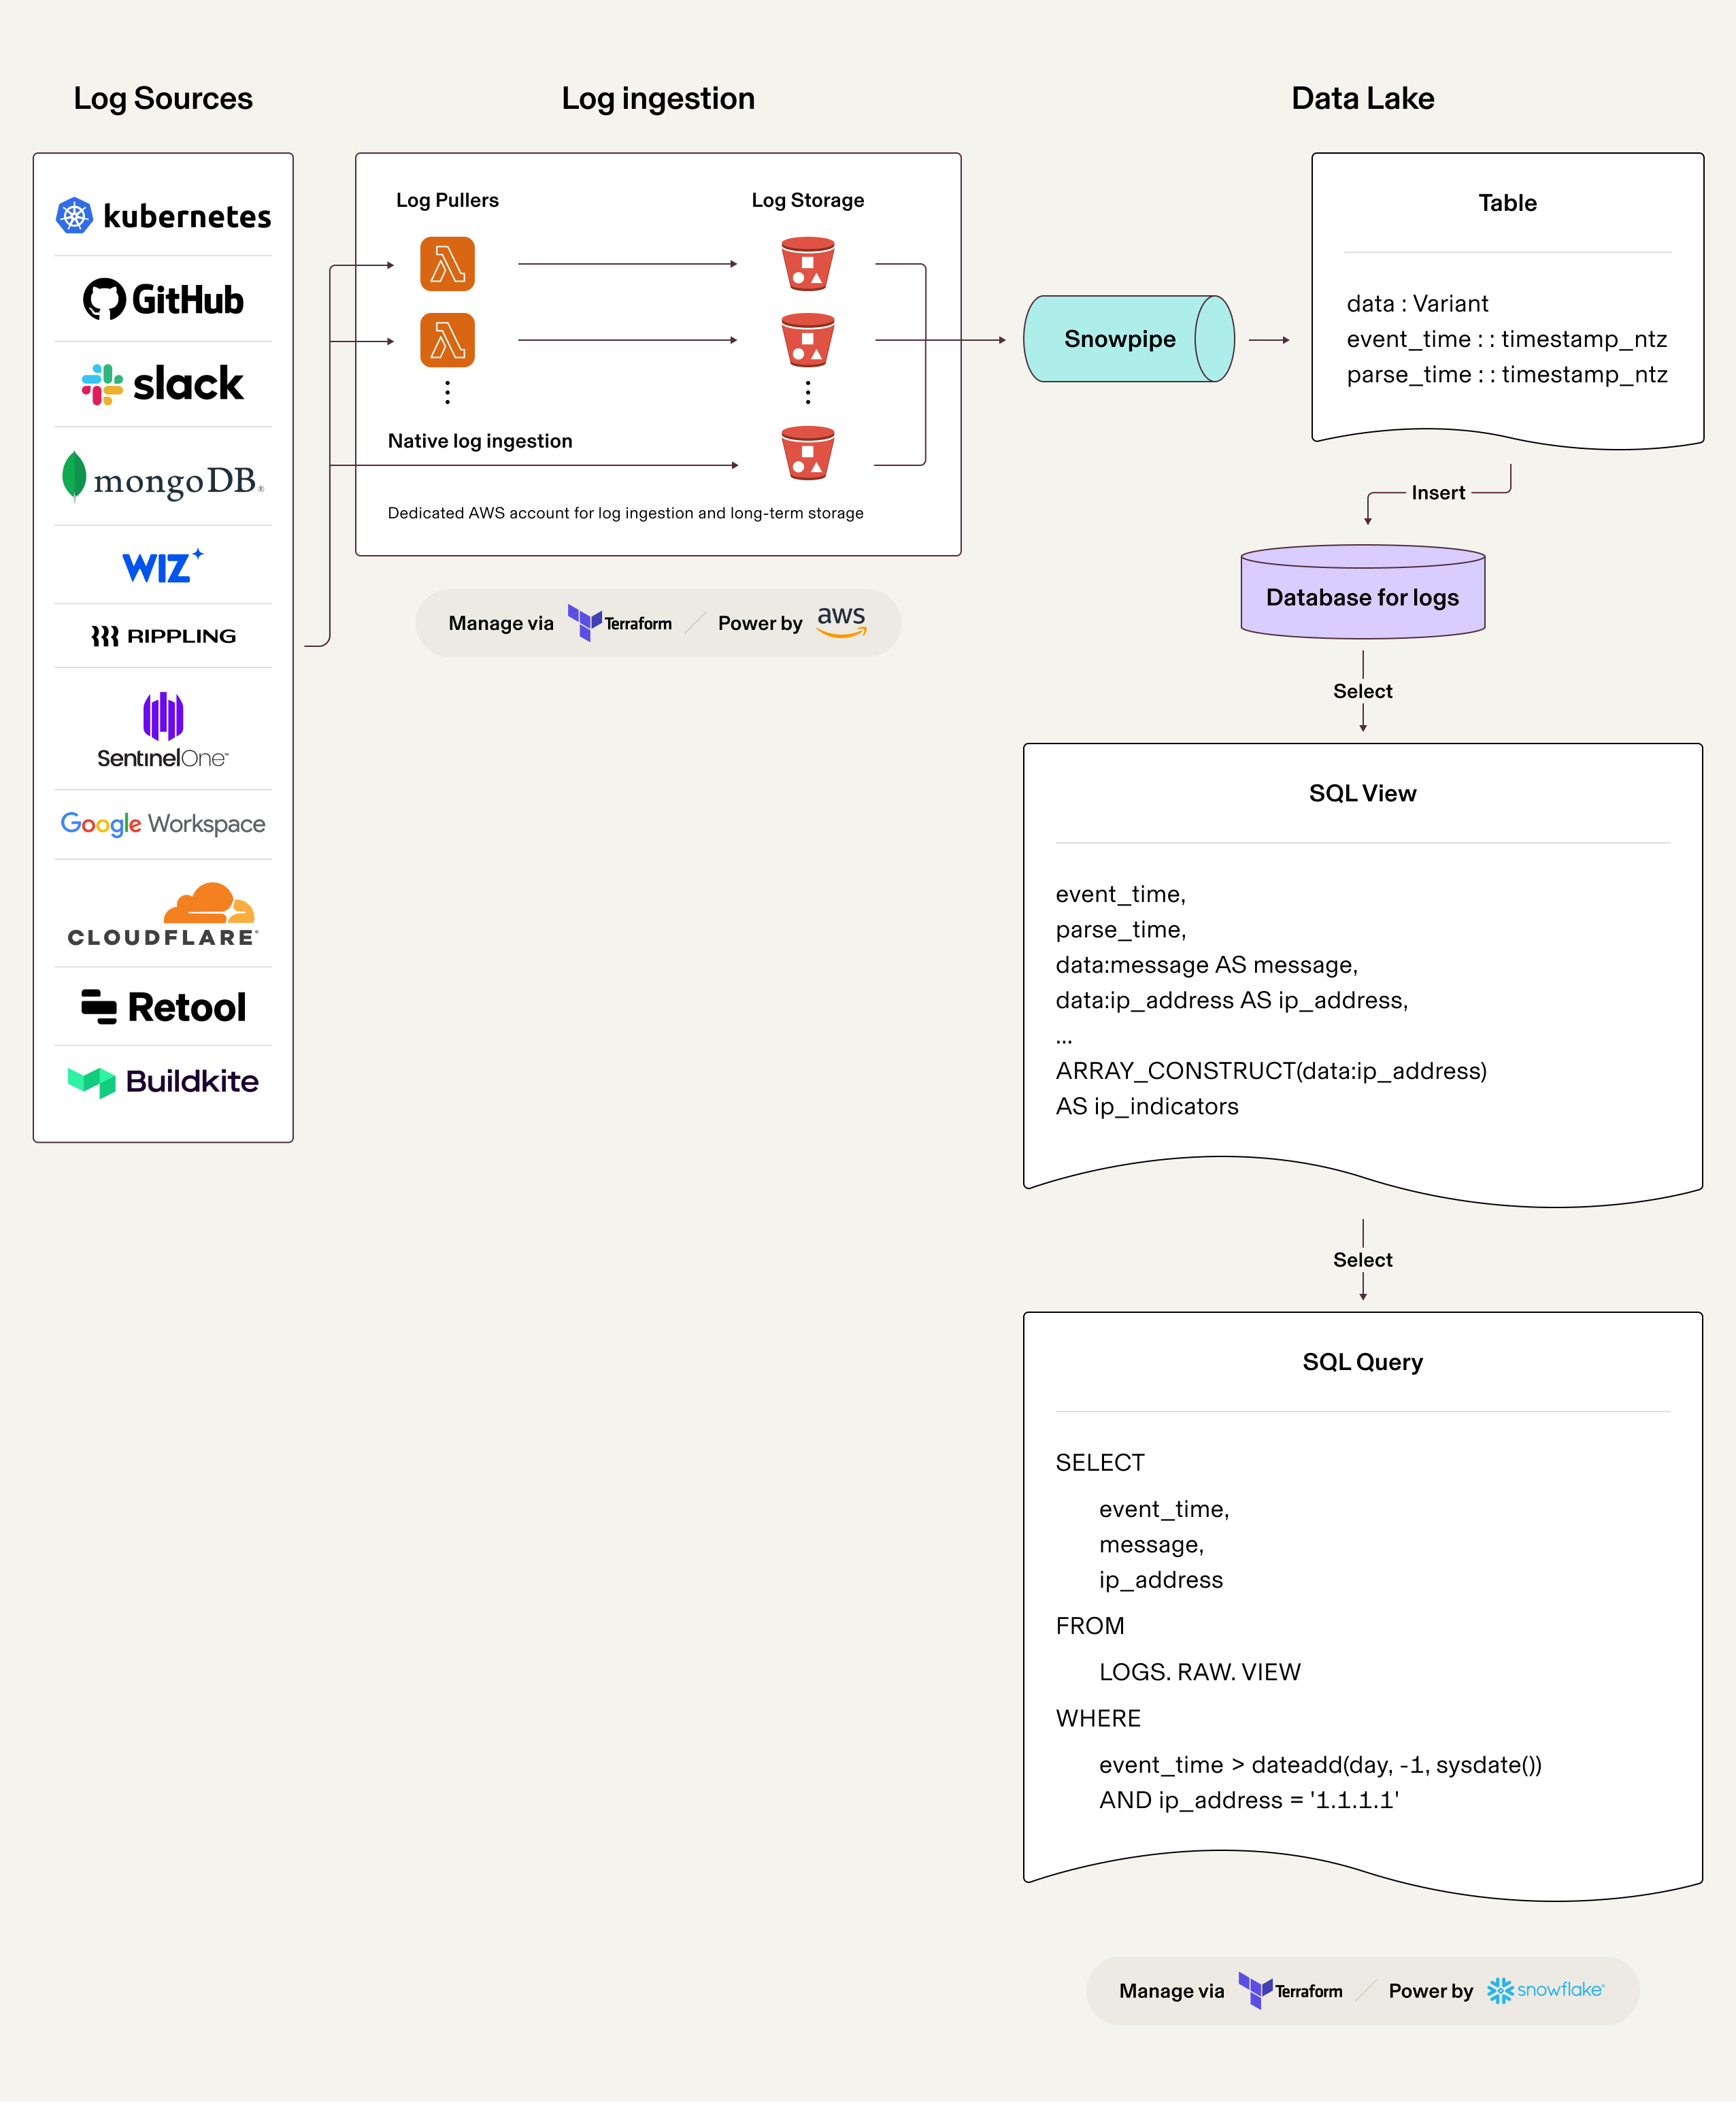
To ensure efficient and standardized log ingestion, we carefully designed the architecture that allows us to ingest logs seamlessly into our security data lakehouse. It caters to various log sources, supports native capabilities, and leverages custom log pullers to optimize data flow. Let's dive into the key components of our log ingestion architecture.
Modularization and Terraform
Our approach to log ingestion revolves around the core principle of Infrastructure as Code (IaC). By treating infrastructure as software, we can standardize and automate the log ingestion process. This approach enhances collaboration, enables version control, and reduces the likelihood of configuration drift.
Key to our implementation is the use of Terraform, an infrastructure-as-code tool that automates the provisioning and management of our cloud infrastructure. For example, we used Terraform to automate the setup of our data ingestion pipelines, which aggregate logs from various sources into our security data lakehouse. This automation not only sped up the deployment process but also ensured consistency and reduced the possibility of human error.
To ensure a scalable and streamlined log ingestion process, all Terraform configurations are modularized. Each aspect of the architecture—from IAM roles for ingesting data into Snowflake to S3 buckets with appropriate IAM and lifecycle policies and the creation of Snowpipes—is encapsulated in separate modules. By modularizing our Terraform configurations, we gain the advantages of reusability, maintainability, and consistency.
Moreover, we’ve integrated Terraform into our CI/CD pipelines. This integration means that any changes to our infrastructure, such as updates or new deployments, are first reviewed and, upon approval, automatically applied. By leveraging Terraform in this way, we've created a more agile and secure infrastructure, which is critical in the rapidly evolving field of cybersecurity.
Below is the code snippet where the S3 bucket for Google Workspace audit logs is defined. Note that it's enough to instantiate the Terraform module to create the S3 bucket and allow Snowflake to read objects from it. The module is also versioned, allowing for better tracking of module changes.
1module "gsuite_s3_bucket" {
2  source                     = "git::ssh://git@github.com/Rippling/secure-terraform.git//modules/aws/s3-log-storage?ref=v1.3.7"
3  env                        = "prod"
4  log_source_name            = "gsuite"
5  snowflake_aws_iam_user_arn = module.prod_acct_security_data_snowflake_integration.snowflake_aws_iam_user_arn
6  snowflake_role_arn         = module.prod_acct_security_data_snowflake_integration.snowflake_role_arn
7}
Ingesting logs into S3 buckets
In our log ingestion process, the primary step is to ensure complete ingestion of all logs into S3 buckets. We prioritize using the log source’s native capabilities for efficiency. These native integrations allow for direct delivery of logs to designated S3 buckets, removing the need for extra intermediaries. Using this method, we simplify the ingestion process and minimize the risk of data loss or delays.
Custom log pullers
For log sources that lack native capabilities, we implement custom log pullers as lambda functions. These lambda functions are designed to fetch logs from various sources, like API interfaces, ensuring a broad range of compatibility. To standardize and streamline this process, we developed a set of standard libraries in both Golang and Python. We chose Golang for its superior performance—which is ideal for handling hefty log sources—while Python is employed for standard use cases due to its wide industry adoption and extensive open-source library support.
Our standard libraries also ensure consistency and maintain data state across lambda executions. These libraries are integrated into lambda layers, facilitating the transfer of logs to S3 in a consistent data format (newline-delimited JSON) and fostering a standardized approach to log ingestion.
Below you can find a sample code snipped in Python ingesting Google Workspace audit logs using a custom log puller. Notice how logs are shipped into the S3 bucket using imported functions, which are mapped to the lambda function as a lambda layer.
1import json
2import os
3import boto3
4from datetime import datetime, timedelta
5import logging
6from puller_helpers.aws_puller_helpers import (
7    save_state,
8    load_state,
9    send_logs_to_s3,
10    get_secret_value,
11    logger
12)
13from google.oauth2 import service_account
14from googleapiclient.discovery import build
15
16# Initialize the logger
17logger = logger()
18
19# Environment variables
20SENTRY_DSN = os.environ['SENTRY_DSN']
21GSUITE_CREDENTIALS = os.environ['GSUITE_SECRET_NAME']
22S3_BUCKET = os.environ['S3_BUCKET']
23S3_STATE_OBJECT_KEY = os.environ['S3_STATE_OBJECT_KEY']
24ADMIN_USER = os.environ['ADMIN_USER']
25
26# List of G Suite applications to fetch logs
27GSUITE_APPLICATIONS = [
28    'admin','calendar', 'drive', 'login', 'gmail, 'groups'
29]
30
31sentry_dsn_value = get_secret_value(SENTRY_DSN)
32sentry_sdk.init(
33    dsn=sentry_dsn_value,
34    integrations=[AwsLambdaIntegration()],
35    traces_sample_rate=1.0
36)
37
38def get_gsuite_logs(start_time, end_time, credentials):
39    # Authenticate with GSuite
40    credentials = service_account.Credentials.from_service_account_info(json.loads(credentials))
41    credentials = credentials.with_subject(ADMIN_USER)
42    service = build('admin', 'reports_v1', credentials=credentials)
43
44    # Fetch GSuite logs for all applications
45    all_logs = []
46    logger.info(f"Fetching GSuite logs from {start_time} to {end_time}")
47    for app_name in GSUITE_APPLICATIONS:
48        logger.info(f"Fetching GSuite logs for application: {app_name}")
49        page_token = None
50        while True:
51            results = service.activities().list(
52                userKey='all',
53                applicationName=app_name,
54                startTime=start_time,
55                endTime=end_time,
56                pageToken=page_token
57            ).execute()
58            logs = results.get('items', [])
59            all_logs.extend(logs)
60            page_token = results.get('nextPageToken')
61            if not page_token:
62                break
63    logger.info(f"Total logs fetched: {len(all_logs)}")
64    return all_logs
65
66
67def lambda_handler(event, context):
68    logger.info('Starting GSuite logs puller')
69    state = load_state(s3_client, S3_BUCKET, S3_STATE_OBJECT_KEY)
70    if not state.get('last_run_time', None):
71        state['last_run_time'] = (datetime.utcnow() - timedelta(minutes=30)).strftime('%Y-%m-%dT%H:%M:%S.%f')[:-3] + 'Z'
72    start_time = state['last_run_time']
73    end_time = datetime.utcnow().strftime('%Y-%m-%dT%H:%M:%S.%f')[:-3] + 'Z'
74    credentials = get_secret_value(GSUITE_CREDENTIALS)
75    logs = get_gsuite_logs(start_time, end_time, credentials)
76    if logs:
77        logger.info(f"Sending {len(logs)} logs to S3")
78        send_logs_to_s3(s3_client, logs, S3_BUCKET)
79        save_state(s3_client, S3_BUCKET, S3_STATE_OBJECT_KEY, {'last_run_time': end_time})
80    logger.info('GSuite logs puller completed')
81    return {
82        'statusCode': 200,
83        'body': json.dumps('GSuite logs ingested successfully')
84    }
Log puller reliability
Developing a custom log puller involves more than just transferring logs to an S3 bucket; it also requires ensuring the completeness of logs and identifying and properly handling unexpected execution failures. To bolster the robustness of our data flow, we’ve adopted the same standard as our engineering team: the use of Sentry. Sentry enables us to swiftly identify, track, and deduplicate errors, helping us quickly address any emerging issues and uncover their root causes.
As demonstrated in the code snippet above, we initialize Sentry at the beginning and extensively leverage it throughout our operations. Sentry's automatic exception capturing reduces the need for numerous try-except blocks in our code. For cases not handled by Sentry, such as lambda execution failures occurring before Sentry is initialized, we use CloudWatch logs monitoring to guarantee we don’t miss any errors.
Loading data into the data lakehouse
Once the logs are securely stored in S3 buckets, the next step is to load this data into Snowflake. We employ Snowpipe, a feature of Snowflake that automatically loads data from S3 into designated tables. Snowpipes provide near-real-time ingestion, ensuring that new log data is rapidly made available for analysis—in most of our cases, the ingestion latency is less than one minute.
To ensure sufficient scalability, we require each log source to use a dedicated Snowpipe and table in Snowflake. This approach also aids in managing access to different tables and better structures our database.
Similarly to the previous code snipped, every resource in Snowflake is also standardized by instantiating the versioned Terraform module. Below is an example for creating log tables, SQL view, and a Snowpipe for Google Workspace audit logs.
1module "gsuite_audit_logs_table" {
2  source        = "git::ssh://git@github.com/Rippling/secure-terraform.git//modules/snowflake/semi-structured-table?ref=v1.3.7"
3  database_name = "LOGS_PROD"
4  schema_name   = "RAW"
5  table_name    = "GSUITE_AUDIT"
6  comment       = "A table for storing Gsuite Audit logs"
7
8  schema_views = {
9    GSUITE_AUDIT_VIEW = <<EOT
10SELECT
11    parse_time as parse_time,
12    event_time as event_time,
13    data:kind as kind,
14    data:id.time as time,
15    data:id.applicationName as applicationName,
16    data:id.customerId as customerId,
17    data:actor.email as actorEmail,
18    data:actor.profileId as actorProfileId,
19    data:ipAddress as ipAddress,
20    data:events as events,
21    ARRAY_CONSTRUCT(data:ipAddress) AS ip_indicators,
22    ARRAY_CONSTRUCT(data:actor.email) AS email_indicators
23FROM
24    LOGS_PROD.RAW.GSUITE_AUDIT
25EOT
26  }
27  providers = {
28    snowflake.data_ingestor = snowflake.data_ingestor
29  }
30}
31
32module "snowpipe_gsuite_audit_logs" {
33  source = "git::ssh://git@github.com/Rippling/secure-terraform.git//modules/snowflake/snowpipe?ref=v1.3.7"
34  database           = module.gsuite_audit_logs_table.database_name
35  schema             = module.gsuite_audit_logs_table.schema_name
36  table_name         = module.gsuite_audit_logs_table.table_name
37  s3_prefix          = "logs/"
38  bucket_name = "<redacted>"
39  sns_topic_arn = "<redacted>"
40  storage_integration_name = module.storage_integration_acct_security_data.storage_integration_name
41  event_time_field = "id.time"
42  providers = {
43    snowflake.data_ingestor = snowflake.data_ingestor
44  }
45}
Data lakehouse transformation
In our journey toward establishing a security data lakehouse, we leveraged Snowflake's basic capabilities. The approach and design implemented by our team were crucial in transforming it into the comprehensive solution we now recognize. Let's delve into the details of this transformation process.
Embracing semi-structured data in JSON format
As part of our requirements, we consciously decided to standardize all log sources to use JSON as the preferred format for semi-structured data. This choice allowed us to effectively store, organize, and analyze diverse log data within Snowflake, regardless of its origin. By adopting JSON, we gained the flexibility to accommodate various data sources and easily handle future extensions. If a given log source doesn’t produce logs in JSON, we create a lambda function to appropriately parse these logs and make them compliant with our requirement to have all logs in JSON.
To efficiently store semi-structured data in Snowflake, we utilize its VARIANT type. This data type specifically accommodates JSON, enabling us to load log entries into Snowflake without the need for rigidly predefined schemas. The VARIANT type allows us to store logs with differing structures, making it a good choice for diverse log sources.
Creating dynamic schemas with SQL views
Snowflake's support for selecting subfields from JSON objects plays a crucial role in our transformation process. By creating SQL views on log entries loaded into the VARIANT column, we can dynamically define schemas for the ingested logs. This dynamic schema approach not only facilitates data ingestion but also allows us to modify the schema for logs already in the data lakehouse.
Flexibility and data clustering with parse time and event time
In the interest of better data organization and clustering, we introduced two separate columns: parse_time and event_time. The parse_time represents the timestamp when a log entry was ingested into the designated table in the data lakehouse. On the other hand, the event_time denotes the timestamp taken from within the log entry, representing the time when the event actually occurred.
The inclusion of parse_time and event_time enables us to cluster the data effectively, optimizing query performance and facilitating quicker analysis. Additionally, having readily available timestamps enhances our incident response capabilities, as we can precisely pinpoint the ingestion time and the event occurrence. It also allows us to quickly spot and react to any ingestion delays.
In addition to leveraging event_time for data clustering, our Terraform module provides the flexibility to define custom data clustering keys, enhancing query performance significantly. This feature proves invaluable, especially in tables that encompass dozens of terabytes of logs. By establishing tailored clustering keys, we can streamline our queries, focusing on the most relevant data sets and avoiding the inefficiency of sifting through unnecessary data. This not only speeds up our query response times but also contributes to more precise and efficient data management, which is crucial in handling large-scale log data.
SQL and query efficiency
Our requirements emphasize the need for a robust query language backed by extensive documentation and examples. Snowflake meets this need by offering SQL as its query language.
When handling semi-structured data and employing logical (or dynamic) schemas, such as those in SQL views, query efficiency becomes critical. Despite clustering our databases based on event times, we sometimes encountered lengthy execution times for queries on large tables, occasionally taking up to an hour. To improve query execution efficiency—particularly for extensive searches across hundreds of gigabytes of data over long periods—we utilize Snowflake's search optimization service. This service significantly reduces the time required for queries in VARIANT type columns, enhancing our ability to conduct data analysis efficiently. Based on our observation, you can reduce the query time by up to several dozen times using the service.
In addition to utilizing Snowflake's search optimization service, we've also adopted their query acceleration service to further enhance our query efficiency, particularly when dealing with complex JSON objects. This service proves invaluable in executing queries that involve large volumes of data coupled with specific filters. By offloading some of the computational demands to Snowflake's additional processing power, query acceleration significantly reduces the time required to obtain query results. This not only accelerates our data retrieval processes but also enables us to manage and analyze big data more effectively.
Utilizing the companywide data lakehouse
Once logs are stored in our security data lakehouse, and with the knowledge that there’s another instance (specifically, a different Snowflake account) deployed in our environment containing additional and helpful information, we can utilize this data. To access the data already loaded in the companywide data lakehouse, we employ Secure Data Sharing in Snowflake. The architecture for this process is shown below:
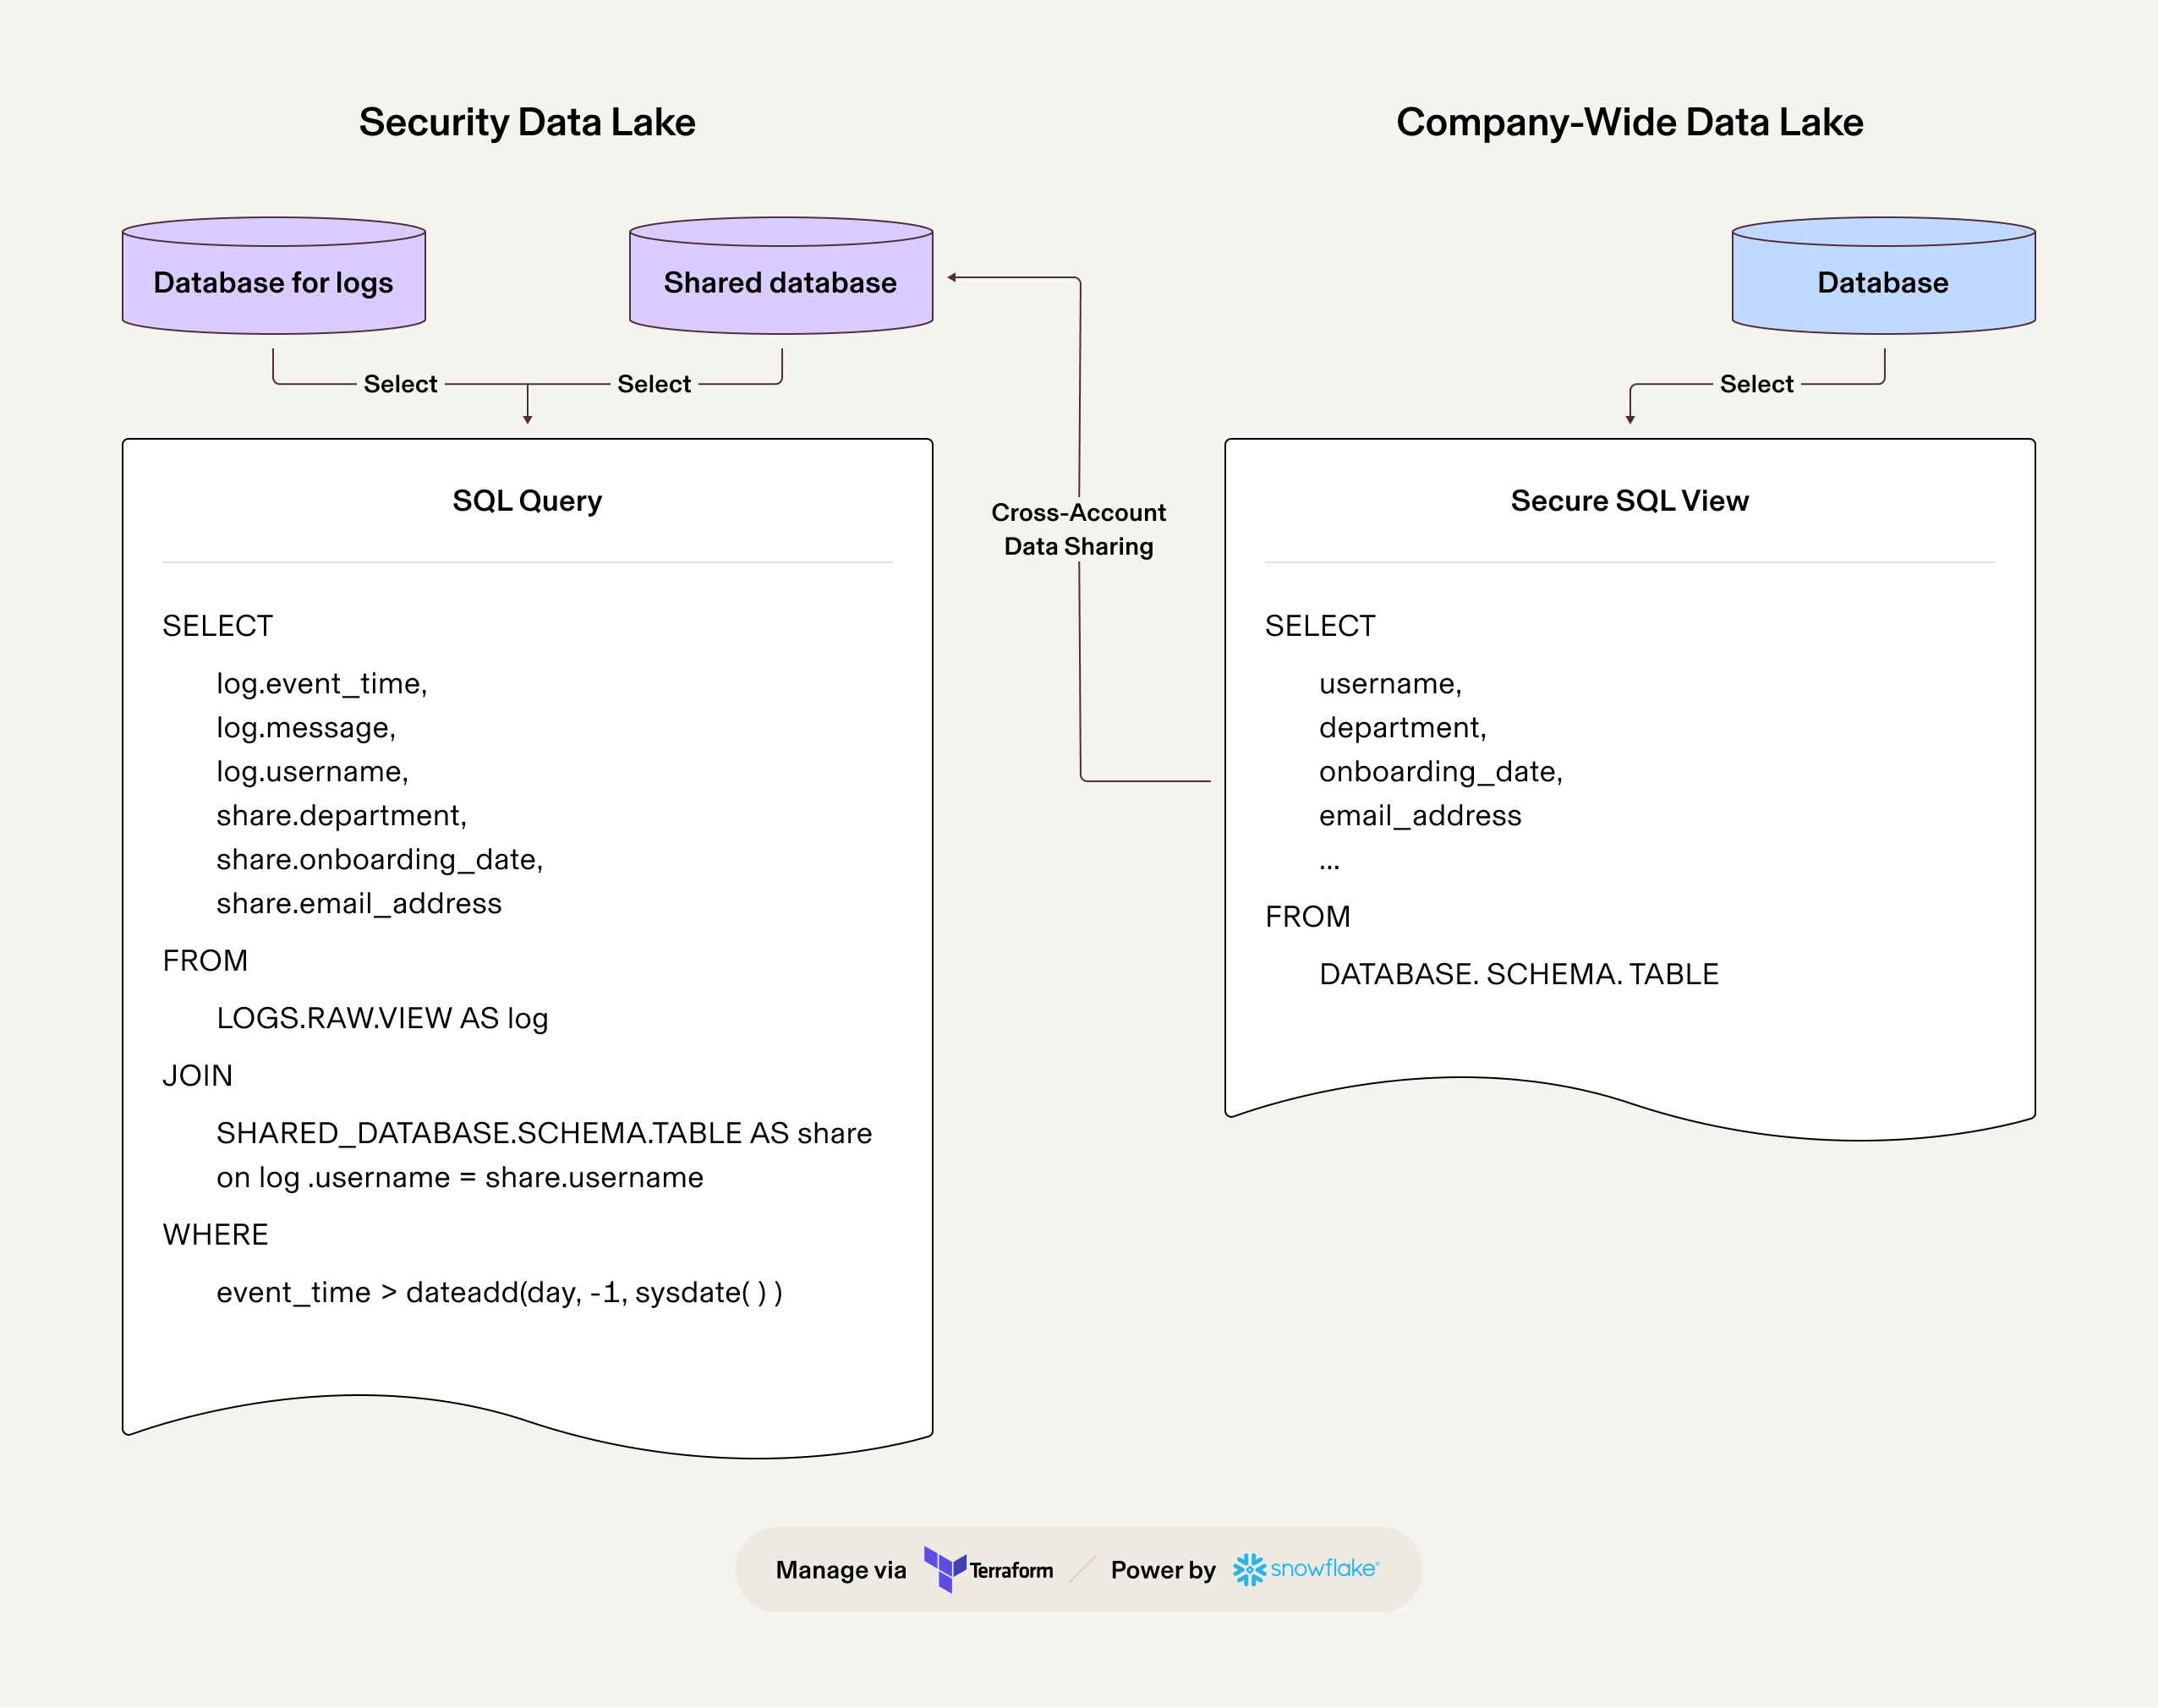
We configure Secure Views in the share provider account, then expose these views to our security data lakehouse account. This allows us to use JOIN operations to enrich our logs. It's important to note that in this scenario, data reingestion is unnecessary; the share consumer account reads data directly from the tables where it's stored. This setup underscores the ease with which we can access other data relevant to our investigations.
Among the many use cases we've implemented are:
- Enriching our queries with data from our human resources information system (HRIS), including information like onboarding and offboarding dates, department, contact information, direct manager, and location
- Enhancing our queries with data from other internally developed tools, such as Device Management Agents
Resilience and high availability
Our security data lakehouse solution is not merely a log aggregation and monitoring system; it's a critical infrastructure component that requires high availability and resilience. To detect and swiftly respond to any log ingestion-related issues, inefficient queries that lead to increased credit consumption in Snowflake, or any challenges in our critical operations within the data lakehouse, we needed suitable monitoring and integration with our companywide tools. This integration is necessary for issue ticketing and notifying the on-call team. Since Snowflake doesn’t provide these capabilities out of the box, we had to design and implement them.
Ensuring uninterrupted log ingestion
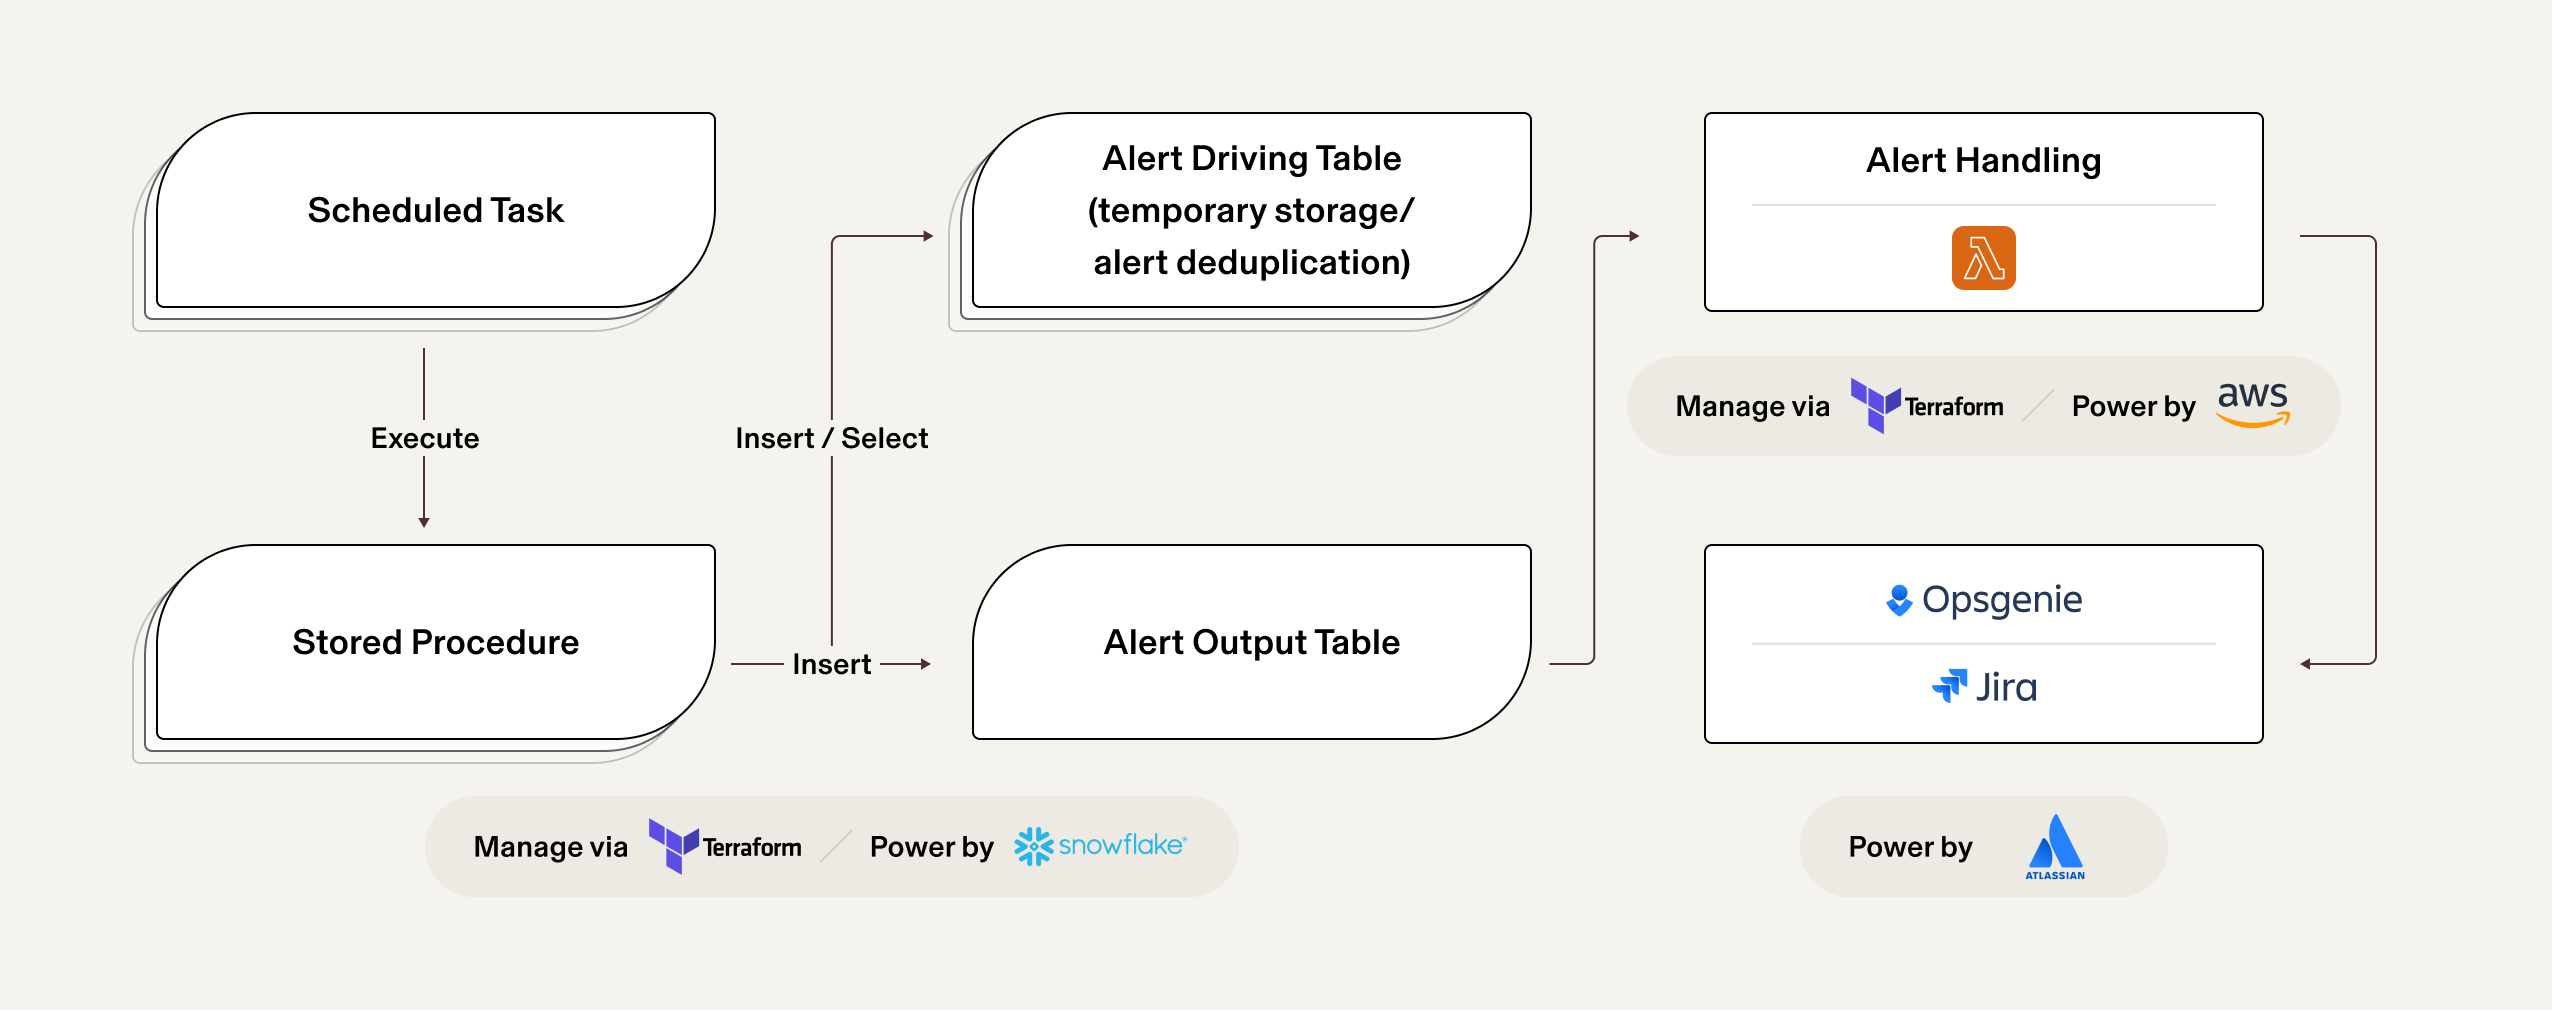
To ensure uninterrupted log ingestion (such as in the event of an unintended configuration change), we use a technique known as log canaries. In our system, log canaries are implemented as stored procedures configured and executed via scheduled tasks. These procedures are responsible for counting the number of logs ingested within a specific time frame. For instance, consider a scenario where a JSON object, serving as a canary definition containing information about the table name and the time frame, is input into the procedure. This procedure then counts the logs ingested into a specified table over a given time. If it detects an absence of logs in the table, it triggers the insertion of a row into an alert table. To prevent overwhelming our on-call team with excessive alerts, we also employ a secondary table. This table temporarily holds information about activated alerts and helps in deduplicating (suppressing) alerts for a predetermined time, as defined in the canary definition. Below is an example of a log canary definition for Google Workspace audit logs. Note that it is also instantiated using a Terraform module with employed versioning.
1module "snowflake_monitoring" {
2  source        = "git::ssh://git@github.com/Rippling/secure-terraform.git//modules/snowflake/snowflake-monitoring?ref=v1.3.7"
3  env           = "prod"
4  database_name = "monitor"
5  schema_name   = "monitor"
6  schedule      = "USING CRON */5 * * * * UTC"
7
8  log_canary_definitions = <<EOT
9  [
10    {"table_name": "LOGS_PROD.RAW.GSUITE", "enabled": true, "time_window": 30, "suppression_time": 1440}
11  ]
12  EOT
13}
To read rows from the alert output table, we utilize a dedicated lambda function. This function is tasked with sending notifications to the on-call team for immediate action using our companywide tools, such as Jira (for issue tracking) and Opsgenie (for alerting the on-call team). Generally, the process flow is as follows:
Snowpipes and scheduled tasks monitoring
Our stored procedures also keep a close eye on the status of Snowpipes and scheduled tasks. This involves actively tracking both the status of Snowpipes and the execution of COPY statements within them to guarantee complete log ingestion. Essentially, our goal is to be promptly notified of any failed data loads that could lead to ingestion gaps. Additionally, due to our reliance on scheduled tasks in Snowflake, any task execution failures or tasks in a non-active state will trigger alerts.
Long-running queries
Our stored procedures effectively monitor queries that exceed the one-hour duration threshold. Identifying long-running queries is crucial for pinpointing potential performance bottlenecks or inefficiencies in our log analysis process, thereby ensuring optimal query execution. Additionally, such prolonged queries lead to increased credit usage in Snowflake. We operate under the assumption that all queries lasting longer than one hour indicate inefficiencies and require further investigation.
Log retention policy
We leverage scheduled tasks to successfully manage log retention directly in data lakehouse tables. These tasks are executed daily and ensure that data in those tables adheres to the required retention policy. By systematically purging data that has exceeded the defined retention period, we maintain the data lakehouse's optimization and ensure it retains only relevant and necessary log information. For instances where longer retention periods are needed—while still balancing credit consumption—we opt to retain data for extended periods in S3 buckets. This is achieved by setting appropriate S3 lifecycle policies and choosing more cost-effective S3 storage options.
Below is an example of a Terraform module instantiation, designed to enforce a 365-day log retention policy for Google Workspace audit logs in the data lakehouse table:
1module "gsuite_audit_logs_table_cleaner" {
2  source           = "git::ssh://git@github.com/Rippling/secure-terraform.git//modules/snowflake/table-cleaner?ref=v1.3.7"
3  database_name    = "LOGS"
4  schema_name      = "RAW"
5  table_name       = "GSUITE_AUDIT"
6  retention_period = 365
7  providers = {
8    snowflake.admin = snowflake.administrator
9  }
10}
Making logs tamper-proof
To meet our stringent requirement for tamper-proof logs, we've implemented robust measures within our AWS environment. First, we established a Service Control Policy that effectively denies any API calls attempting to delete S3 objects from our buckets. This policy is designed to permit exceptions only for calls made by AWS services crucial for enforcing our log retention policy. As a result, our logs in S3 are safeguarded against unauthorized deletion.
Second, we developed detections to monitor activities related to altering or dropping lakehouse tables, with exceptions for queries necessary to uphold log retention policies (we’ll cover the methodology of creating detections in detail in a subsequent part of this series). Through these proactive and preventive measures, we maintain the integrity of our logs, ensuring they remain secure and unaltered.
Cost analysis
In our cloud-based environment, where scaling up is easy, it's vital to keep a close eye on costs to prevent overspending. Once we began ingesting logs into our data lakehouse, we immediately implemented monitoring of any resources that significantly impacted our budget. This monitoring offers in-depth insights into how we use our resources and identifies opportunities for increased efficiency. Aligning with our engineering team's methods, we opted for Vantage and created a custom dashboard to better understand and manage our expenses, ensuring we stay on budget while fully leveraging our data lakehouse.
Now, addressing the main question: What is the cost of ingesting several gigabytes of data into the data lakehouse? The answer varies. Estimating storage costs in an S3 bucket is relatively straightforward, but calculating the cost of transferring data into a Snowflake table is more complex. It also depends on whether you need to create and run a custom lambda function in AWS, incurring additional costs, or if you can use a log source's native capabilities—which would avoid lambda execution costs. Furthermore, our requirement to limit ingestion delays to less than 10 minutes means custom lambda functions, if used, must run at intervals of one to 10 minutes.
The total cost of using Snowflake involves several factors:
- Snowpipe cost: the expense of executing COPY operations and loading S3 objects into Snowflake tables
- Storage cost: the expense of using the underlying storage in Snowflake
- Search optimization service cost: the expense of creating and maintaining metadata to expedite queries
- Data reclustering cost: the expense of reorganizing data based on clustering keys
Snowflake's documentation suggests that accurately estimating the overall Snowpipe cost is challenging, recommending that a subset of data be loaded into an S3 bucket and then into a table as a trial to forecast future costs.
Through our optimization process for our security data lakehouse, we've observed the following:
- To align with our maximum ingestion delay requirement and reduce Snowpipe costs, we adjusted the frequency of creating new objects on S3 from one to 10 minutes
- For smaller objects on S3 (significantly less than 10MB), we run log pullers less frequently (close to 10 minutes) to optimize Snowpipe costs
- For larger objects on S3 (between 10 and 100MB), we create new objects more frequently, as objects from 10 to 100MB are the most effective for Snowpipes
Taking these factors into account, we’ve estimated the average cost for ingesting 75GB of logs into Snowflake over a one-month period to be approximately $12.00-$15.00. The AWS cost, including storage and compute, was around $19.00. This calculation is based on data ingested from October 1 to October 31, using Google Workspace audit logs as a reference.
Conclusion
In the end, our log management approach boils down to a clever utilization of our data lakehouse’s capabilities, coupled with a modular design for better scalability, reusability, and cost-effectiveness. As a result, our system can successfully ingest and retain logs without burning through our security budget, providing a solid foundation for the rest of our SIEM tool.
Coming up in part 3: detections and alerting
Join us in the next post as we explore how we use Snowflake, AWS cloud, and Jira for detections, managing alerts, and how this ties into our broader strategy for engineering a SIEM.
Are you intrigued by our progress and challenges? Do you see yourself thriving in a team that takes on exciting projects? If yes, then you're in luck! Rippling is hiring. We're seeking passionate individuals eager to explore the frontiers of technology. Stay tuned for updates, and join us in shaping the future of secure cloud infrastructure.


